

Industrial activity generates heat - and heat tells a story. By capturing thermal signatures from refineries, power plants, and manufacturing facilities worldwide, our satellite imagery transforms invisible temperature patterns into actionable economic intelligence. Whether you're tracking production volumes at steel mills or refineries, assessing energy consumption across power grids, or monitoring activity at data centres before they hit the headlines, thermal monitoring delivers accurate data that traditional economic indicators simply can't match.
With 3.5-metre resolution imagery captured day and night - even through smoke - we can gain unprecedented visibility into the operational realities driving commodity markets, allowing you to identify economic trends earlier and position your strategies accordingly.
Multiple snapshots, greater insight
We can capture multiple thermal snapshots of an industrial site over time, and then compare them to establish a baseline of normal heat patterns and flag any deviations - revealing the true operational reality of a site.
For example, when a facility is officially declared inactive, we can use thermal imagery to detect deviations, heat plumes, or elevated temperatures that might suggest otherwise. This offers a real insight into ongoing activities, regardless of what optical images or public statements may indicate.
Detect and validate anomalies and incidents
High-resolution thermal imagery is particularly effective for identifying and validating anomalies or incidents that could affect site operations. Thermal “hot spots” - or the unexpected absence of heat - can indicate that something out of the ordinary is occurring.
For example, a sudden spike in temperature at a remote asset may signal an operational anomaly, unplanned fire, or explosion. On the other hand, an abrupt cooling at a typically active unit may indicate a shutdown or equipment failure.
Operational monitoring in action: Al Zour oil refinery
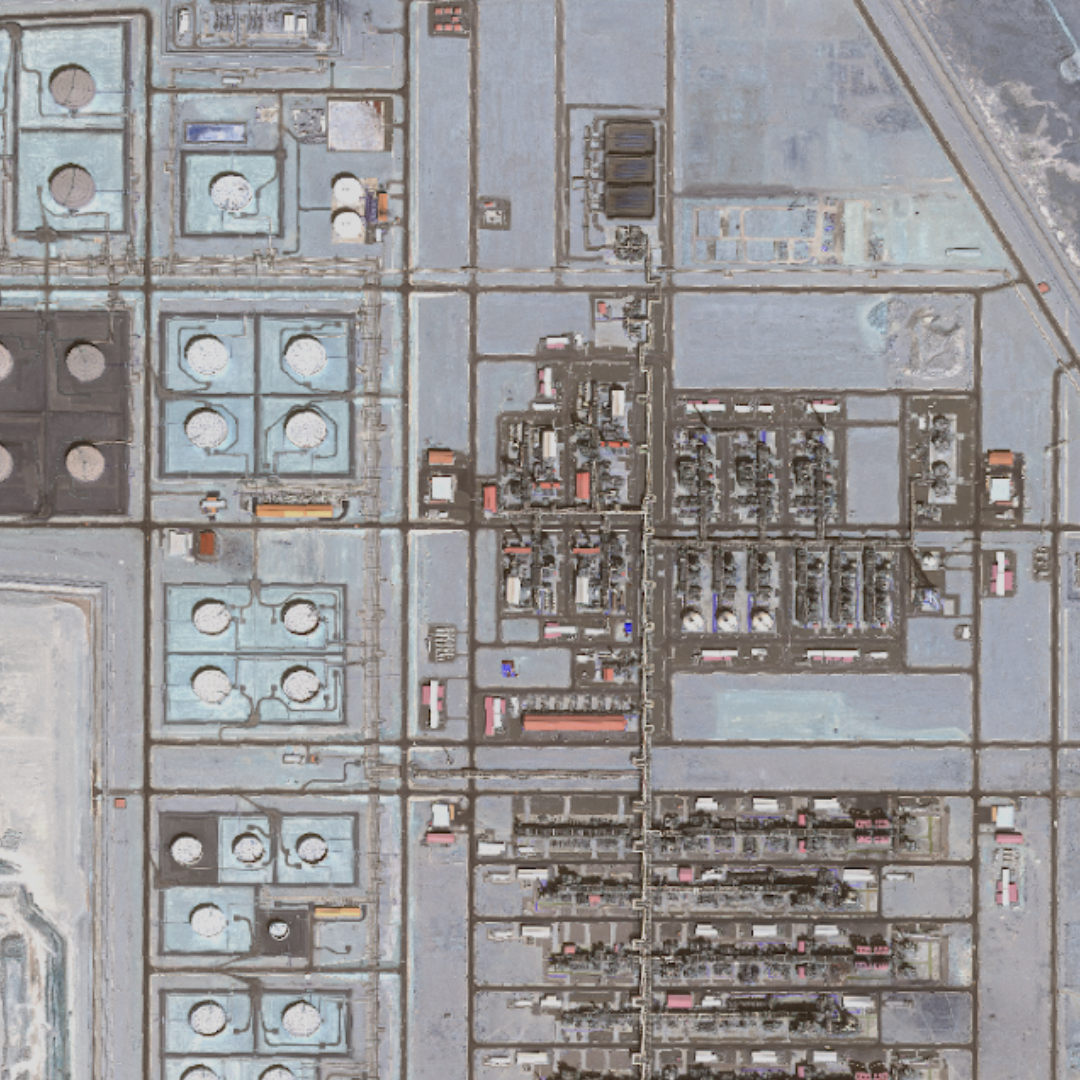
Al Zour, Kuwait, is one of the world's largest refineries, with a refining capacity of 615,000 barrels per day.
Each satellite acquisition captures a footprint of approximately 4 x 4 km², large enough to cover the majority of a typical refinery site. Through multiple acquisitions, we deliver full spatial and temporal coverage - providing a comprehensive, high-level view of the facility and its operational dynamics.
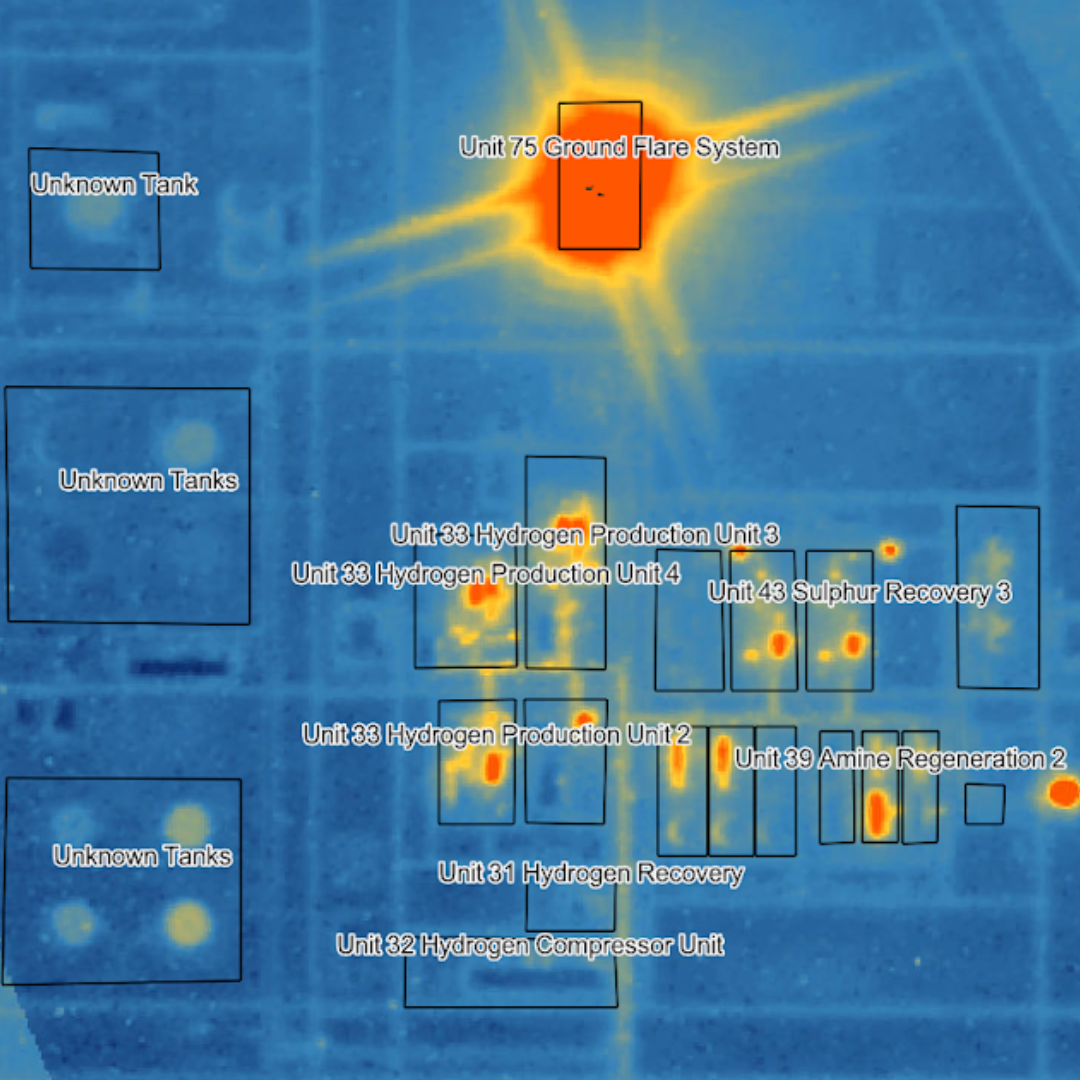
Zooming into the facility, you can clearly observe thermal signals associated with operations within individual sub-plants and the participating assets.
Strong signals are particularly visible from activity in the hydrogen production units and various distillation units across the facility:
We can then zoom into individual sub-plants, using thermal signals to identify which assets are active. Thus offering insights into their operational status, such as idle vs. operating at nominal capacity.
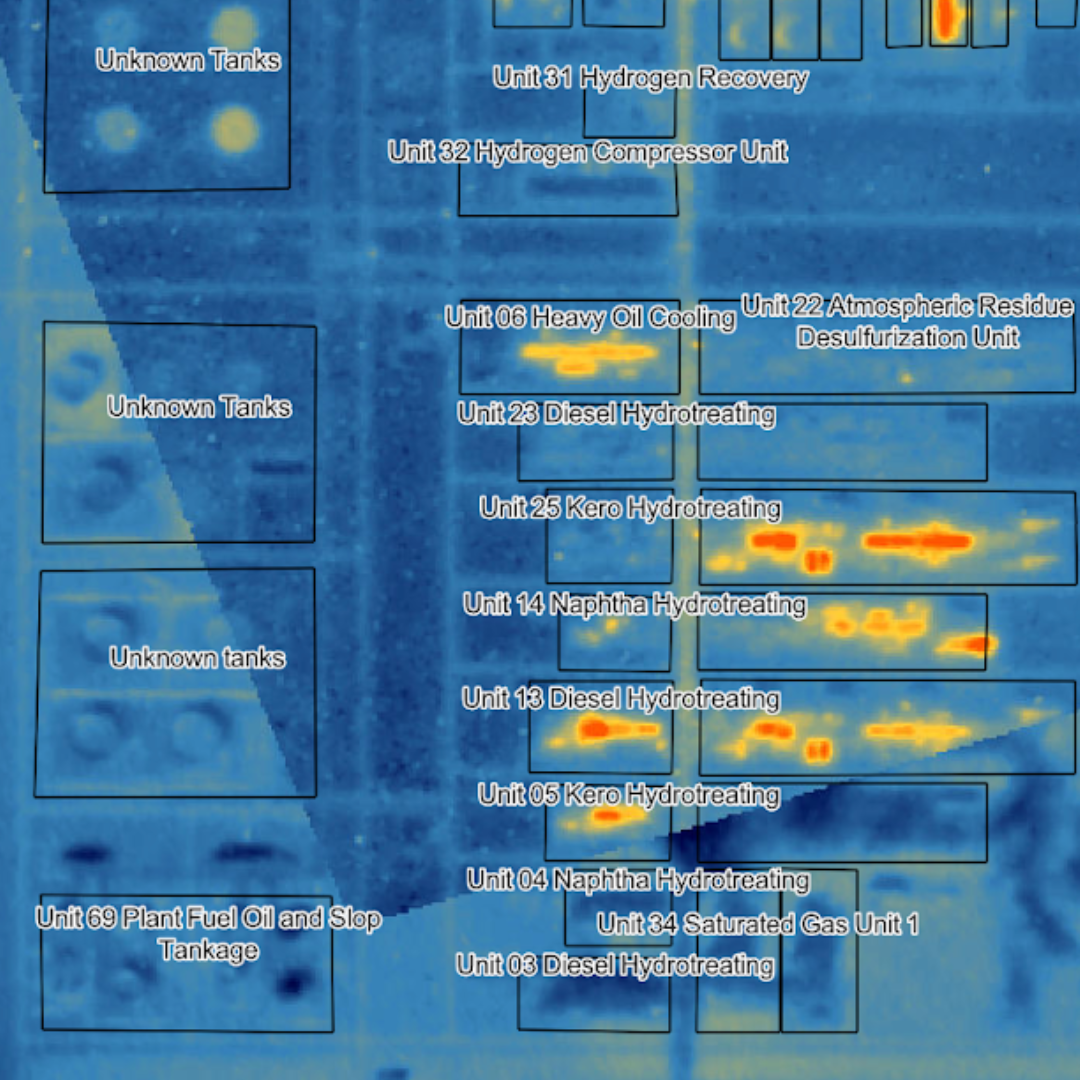
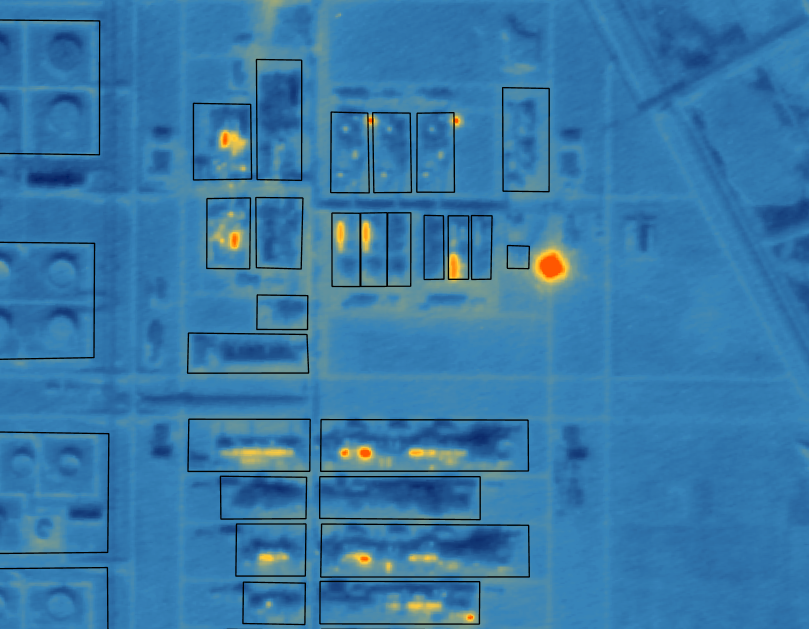
In the image below you can see signals coming from the desulphurisation units, showing evidence of activity:
This level of insight was particularly useful when Open-Source media reports indicated a fire incident took place 16th Nov 2023 within their desulphurisation sub-plant.
We were able to use thermal monitoring to detect and trace the impact of the incident over time. The image below shows the location of the affected facility and first responders managing the incident:
By examining the incident through a ‘thermal lens’, you can clearly observe the following operational timeline.
.gif)
4th November
The thermal imagery shows a consistent heat signature across the facility, indicating nominal operational activity.
17th November
The image captured one day after the incident shows a reduced thermal signature across the refinery - particularly affecting the desulphurisation sub-plant - indicating an impact to normal operations.
30th November
Thermal emissions indicate partial recovery; operations have resumed at the refinery, but the absence of a thermal signature from Unit 12 suggests that the affected sub-plant remains inactive.
As you can see, these insights offer an alternative perspective to the information provided in the news piece, which was released on the same day as the incident.
When monitored over time, SatVu’s thermal satellite imagery reveals a clear, independent view of industrial site activity, delivering genuine insights that inform trading and investment strategies.
By accessing this kind of operational ‘reality’, you can unlock valuable commodity intelligence - transforming heat, and the story it tells, into actionable economic insight.
Interested in learning more? Contact sales@satellitevu.com to discuss.

